Fundamental Overview
This week, gold has been on the rise due to a technical breakout, despite no major catalysts. The lack of negative factors has supported this upward momentum, as investors have adjusted their expectations for aggressive rate cuts that previously affected gold prices.
Gold remains in a bullish trend as real yields are likely to continue falling because of the Fed’s easing cycle. While pullbacks may occur, the overall uptrend should persist unless the Fed changes its approach.
However, a key event to watch is the upcoming US election. If Trump wins, real yields may rise on anticipated economic growth, leading to less expectation of rate cuts, which could trigger a significant drop in gold prices.
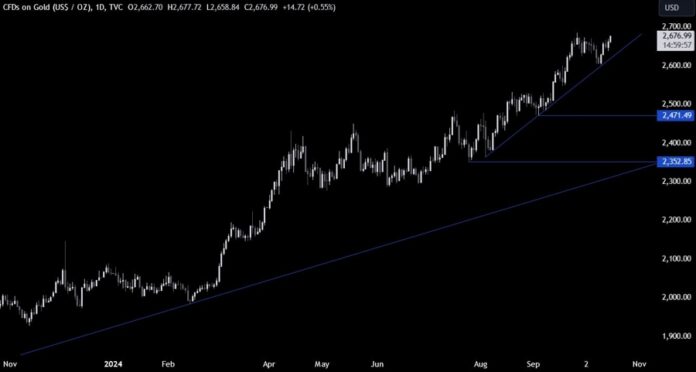
Gold Technical Analysis – Daily Timeframe

On the daily chart, gold has bounced near a key trendline and is approaching its all-time high around the 2685 level. Buyers are looking for a breakout past this high, while sellers may target a pullback at that level.
Gold Technical Analysis – 4 Hour Timeframe

On the 4-hour chart, buyers have overcome some volatility and established another minor upward trendline. If there’s a pullback, buyers are likely to buy in again for new highs, while sellers will look for lower breaks towards the major trendline.
Gold Technical Analysis – 1 Hour Timeframe

The 1-hour chart also shows a minor upward trendline indicating bullish momentum. Buyers will likely continue to support the trendline, while sellers are eyeing a break to target new lows. The red lines represent today’s average daily range.
Upcoming Catalysts
Tomorrow, we will have the US Retail Sales and Jobless Claims data released.

