Overview
The USDJPY pair’s upward momentum is slowing down, even after recent strong US CPI and PPI reports. The market has adjusted expectations for aggressive rate cuts, aligning with the Fed’s projections. More strong US data is needed to encourage the market to anticipate a pause in the Fed’s easing cycle, which could strengthen the US Dollar further.
Long-term US yields are likely to rise, maintaining the USDJPY uptrend. However, clearer bullish signals for the Dollar would attract more buyers. Key events in November, including October data releases and the US election, could influence the market.
Technical Analysis – Daily Chart

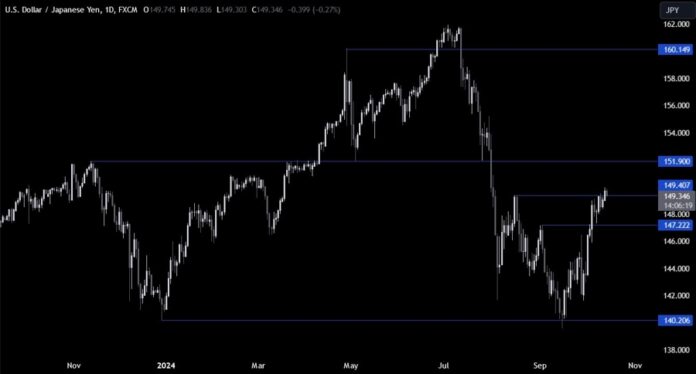
The daily chart shows USDJPY briefly breaking above 149.40 but unable to hold. Sellers may target a drop to 147.22, while buyers will look for a rise above 149.40 to aim for 152.00.
Technical Analysis – 4 Hour Chart

The 4-hour chart indicates a rising wedge pattern around 150.00. Sellers will look for a break downwards to target 147.22, while buyers will watch for support at the bottom trendline for potential new highs.
Technical Analysis – 1 Hour Chart

The 1-hour chart highlights the price action. Sellers are looking for a break below, while buyers seek a bounce off the bottom trendline. The red lines indicate today’s average daily range.
Upcoming Events
This week has limited economic data, with key releases including US Retail Sales and Jobless Claims on Thursday, and Japanese CPI on Friday.

