Fundamental Overview
The Nasdaq rose to recent highs last Friday, despite higher-than-expected US CPI and PPI reports. The Fed focuses on the PCE index, with the Core PCE Y/Y now expected to drop to 2.6%.
The market has adjusted its expectations for rate cuts, aligning closely with the Fed’s projections. This suggests we will see rate cuts amid a resilient economy, which is positive for stocks.
It’s important to note that the Fed’s response has shifted; strong economic data may only delay easing policies, as they are not considering tightening. The next significant market event will be the US elections in November.
Nasdaq Technical Analysis – Daily Timeframe

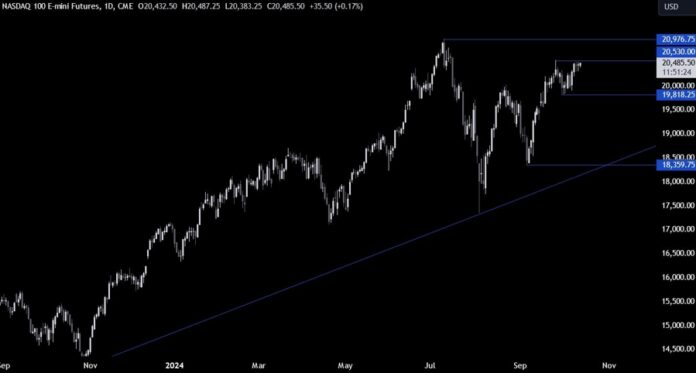
The Nasdaq is approaching the 2530 level on the daily chart, where sellers might step in. Buyers, on the other hand, will be hoping for a breakout to new all-time highs.
Nasdaq Technical Analysis – 4 Hour Timeframe

The 4-hour chart shows prices stabilizing around 20530. Sellers will look for a drop from the highs, while buyers want to see a breakout to drive prices higher.
Nasdaq Technical Analysis – 1 Hour Timeframe

The 1-hour chart indicates consolidation between 2500 resistance and 2330 support. Buyers seek a breakout for new highs, while sellers target a drop to 19800. The red lines indicate today’s average daily range.
Upcoming Catalysts
This week has few key economic releases. Today features a speech from Fed’s Waller, and on Thursday, we will see US Retail Sales and Jobless Claims data.

