Fundamental Overview
The bullish trend for USDJPY is slowing, despite strong US CPI and PPI reports. The market has adjusted its expectations for aggressive rate cuts, aligning closely with the Fed’s plans.
More strong US data is needed to encourage earlier pauses in the Fed’s easing and provide support to the US Dollar.
In the larger context, US long-term yields are likely to rise, which should maintain the uptrend in USDJPY. However, more positive drivers for the dollar will solidify buyer confidence.
Key upcoming events to watch for in November include October data releases and the US elections.
USDJPY Technical Analysis – Daily Timeframe

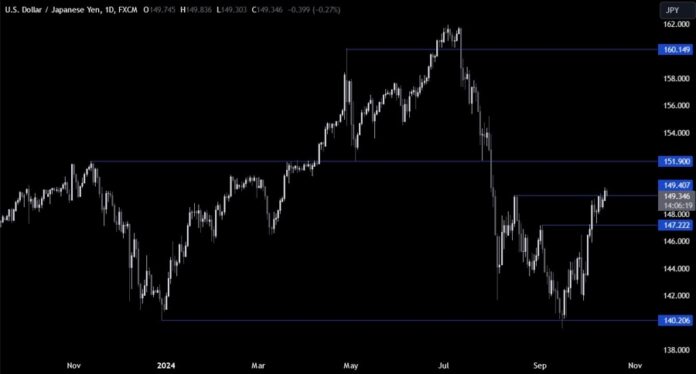
The daily chart shows USDJPY briefly spiked above the key level at 149.40 but couldn’t hold. Sellers may target a drop to 147.22, while buyers hope for a rise above this level towards 152.00.
USDJPY Technical Analysis – 4 Hour Timeframe

The 4-hour chart indicates a rising wedge pattern near 150.00. Sellers will look for a breakout downside towards 147.22, while buyers may defend the bottom trendline for a potential rally.
USDJPY Technical Analysis – 1 Hour Timeframe

The 1-hour chart reveals the current price action within the pattern. Sellers anticipate a downside break, while buyers aim for a bounce off the lower trendline, marked by today’s average daily range.
Upcoming Catalysts
This week is light on data, with key releases on Thursday for US Retail Sales and Jobless Claims, followed by Japanese CPI on Friday.

