Overview
The Nasdaq surged to recent highs last Friday, even with surprising US CPI and PPI figures. The Fed focuses on PCE, which is expected to decrease to 2.6% year-over-year.
Now, the market no longer anticipates aggressive rate cuts, aligning with the Fed’s forecasts. This suggests continued rate cuts will support a strong economy and benefit stock markets.
Note that the Fed’s response strategy has shifted; stronger data may lead to a pause in rate easing, not tightening. Upcoming, the US election in November poses a significant risk for the market.
Nasdaq Technical Analysis – Daily Chart

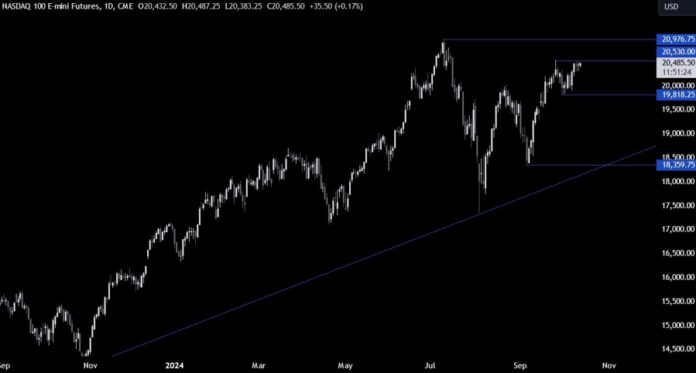
The daily chart shows the Nasdaq nearing recent highs around the 2530 mark. Sellers may enter here, aiming for a drop to 19818, while buyers hope for a breakout to all-time highs.
Nasdaq Technical Analysis – 4-hour Chart

The 4-hour chart reveals recent price action with higher lows towards 20530. Sellers will watch for rejection at this high, whereas buyers want a breakthrough to new highs.
Nasdaq Technical Analysis – 1-hour Chart

The 1-hour chart shows the market stuck between 2500 resistance and 2330 support. Buyers seek an upward breakout, while sellers aim to push lower towards the 19800 level. Red lines indicate today’s average daily range.
Upcoming Events
This week has few economic data releases. Fed’s Waller speaks today; on Thursday, we get US Retail Sales and Jobless Claims data.

