Fundamental Overview
The US Dollar’s bullish momentum is slowing as GBPUSD remains stable, despite strong US data. US Retail Sales exceeded expectations, and Jobless Claims improved significantly.
However, the market has adjusted its view on aggressive rate cuts, aligning closely with the Fed’s forecasts. We need stronger US data and signs of rising inflation to prompt an earlier pause in the Fed’s easing cycle.
Key events in November include the October data release, the FOMC policy meeting, and the US election.
For NZD, this week’s Q3 CPI data fell short of expectations, reinforcing the market’s belief in a 50 basis point rate cut at the next meeting, with a 12% chance of a 75 bps cut.
NZDUSD Technical Analysis – Daily Timeframe

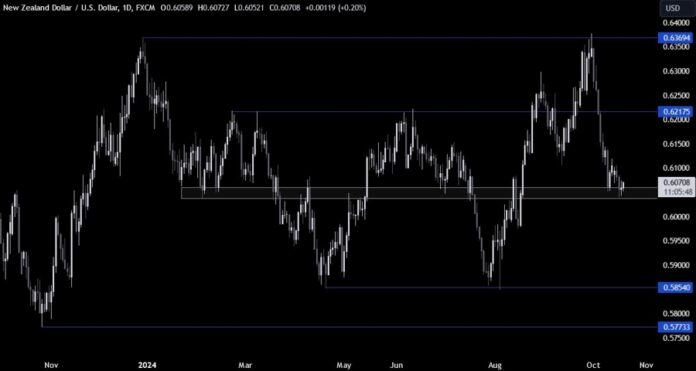
On the daily chart, NZDUSD is consolidating around the 0.6050 support level, where buyers may enter. A breach could lead to a rally towards 0.6217 resistance, while sellers will aim for the 0.5850 support if prices drop below.
NZDUSD Technical Analysis – 4 Hour Timeframe

The 4-hour chart shows constrained price action; 0.61 serves as resistance. A move above this could increase bullish momentum towards 0.6217 resistance.
NZDUSD Technical Analysis – 1 Hour Timeframe

On the 1-hour chart, the market may continue trading within the current range until a breakout occurs. The red lines represent today’s average daily range.

