Fundamental Overview
The US Dollar’s upward trend may be slowing, as GBPUSD hasn’t dropped to new lows despite strong US economic data. Recent US Retail Sales exceeded expectations significantly, and Jobless Claims were better than anticipated.
However, the market has adjusted its expectations for aggressive rate cuts, aligning closely with the Federal Reserve’s forecasts. To see an earlier pause in the Fed’s easing, we need stronger US data and signs of rising inflation.
Key risk events are coming in November with October data releases, the FOMC policy decision, and the US election.
For the NZD, New Zealand’s Q3 CPI data fell short of expectations, reinforcing market predictions for a 50 basis point rate cut at the next meeting, with a 12% chance of a more significant 75 basis point cut.
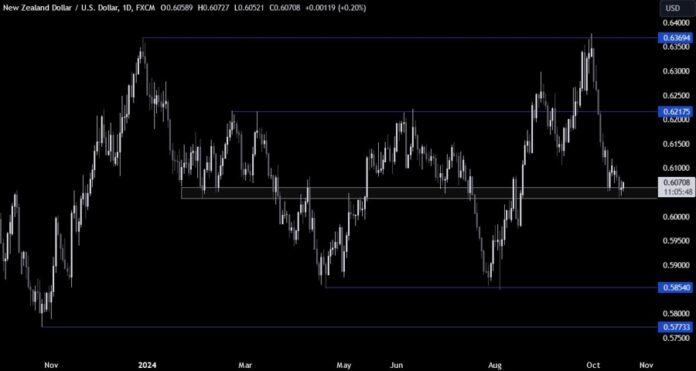
NZDUSD Technical Analysis – Daily Timeframe

On the daily chart, NZDUSD is stabilizing around the key support level of 0.6050. Buyers may enter here, targeting a rally towards 0.6217 resistance. Sellers will look for a break below this support to push prices down to 0.5850.
NZDUSD Technical Analysis – 4 Hour Timeframe

The 4-hour chart shows limited price movement, with resistance at 0.61. A breakout above this level may increase bullish momentum toward the 0.6217 resistance.
NZDUSD Technical Analysis – 1 Hour Timeframe

The 1-hour chart doesn’t provide many new insights, as trading likely remains within the defined range until a breakout occurs. The red lines indicate today’s average daily range.

