Fundamental Overview
Last week, gold prices dipped but found support at a key trendline as they adjusted to rising real yields after the strong US NFP report. Despite high US CPI and PPI figures, the market still expects rate cuts, allowing gold to resume its upward trend.
Overall, gold remains in a bullish trend due to anticipated falling real yields as the Fed eases rates. Pullbacks may occur with changes in rate cut predictions, but the uptrend should continue unless the Fed’s stance alters.
Gold Technical Analysis – Daily Timeframe

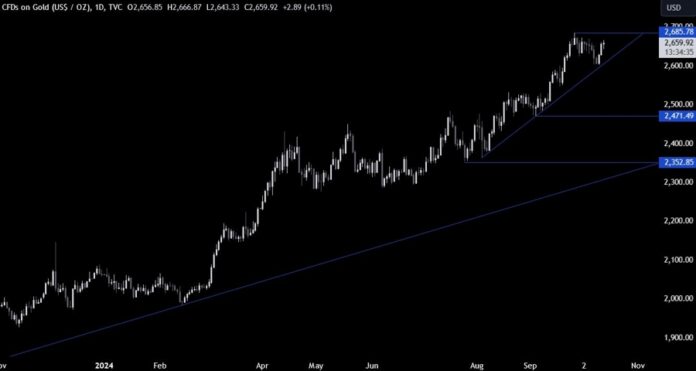
On the daily chart, gold bounced off a crucial trendline, rising towards 2666. The next target is the all-time high around 2685, where breaking through could boost bullish sentiment. Sellers will lookout for breaks below the trendline, aiming for 2500 as a first target.
Gold Technical Analysis – 4 Hour Timeframe

The 4-hour chart shows a break above the counter-trendline, indicating potential buying interest to reach the all-time high. Conversely, sellers will watch for a drop below this line to target a return to the main upward trendline.
Gold Technical Analysis – 1 Hour Timeframe

The 1-hour chart shows a minor upward trendline defining bullish momentum. Buyers may support prices near this trendline aiming for the all-time high, while sellers will be alert for a break, pushing prices down towards the major trendline. The red lines indicate today’s average daily range.
Upcoming Catalysts
This week has limited economic data, with a few significant releases. Today, Fed’s Waller will speak, and on Thursday, the US Retail Sales and Jobless Claims data will be released.
See the video below
`

