Fundamental Overview
No major news has driven the gold rally this week, but a key technical breakout may have boosted bullish sentiment.
The absence of bearish factors supports ongoing demand, as the market adjusts its expectations for aggressive rate cuts that previously affected gold by raising real yields.
Overall, gold is in a bullish trend, with falling real yields expected during the Federal Reserve’s easing phase. Any pullbacks will likely be linked to changes in rate cut expectations, but the uptrend seems secure unless the Fed’s stance shifts significantly.
A potential risk for gold prices is the upcoming US election. A Trump win could increase real yields by raising growth expectations and reducing the likelihood of rate cuts, so keep an eye on that.
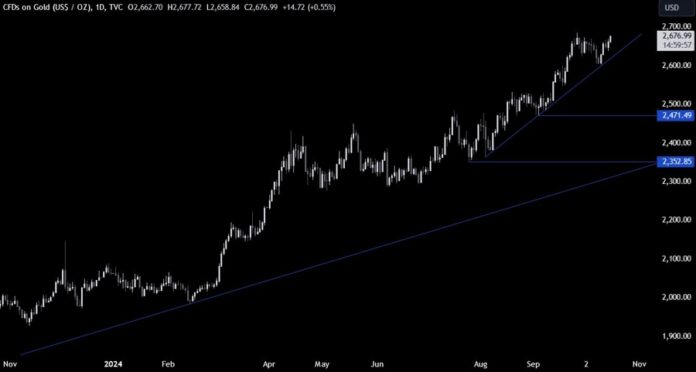
Gold Technical Analysis – Daily Timeframe

The daily chart shows gold bouncing near a key trendline, approaching the all-time high around 2685. Buyers want a breakout to encourage further bullish activity, while sellers may position for a pullback near this high.
Gold Technical Analysis – 4 Hour Timeframe

The 4-hour chart shows some volatile price action, but buyers have gained momentum. A minor upward trendline indicates current bullish activity, with buyers watching for a pullback to seize new highs. Sellers aim to break lower targeting the major trendline.
Gold Technical Analysis – 1 Hour Timeframe

The 1-hour chart displays a minor upward trendline sustaining bullish momentum. Buyers will likely lean on this trendline for further gains, while sellers look for a break to target new lows. The red lines represent today’s average daily range.
Upcoming Catalysts
Tomorrow, we will receive US Retail Sales and Jobless Claims data.
See the video below
`

