Fundamental Overview
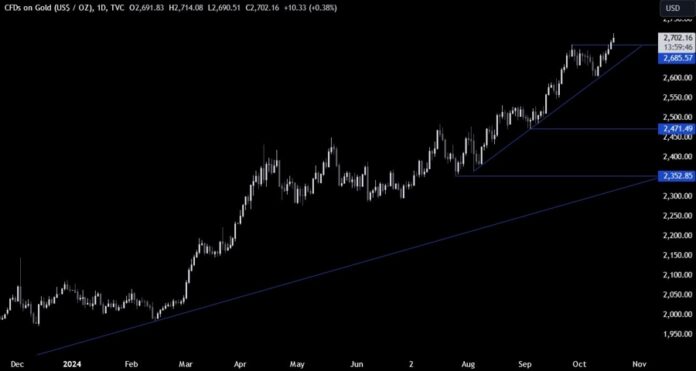
Gold reached a new all-time high yesterday, despite strong US Retail Sales and Jobless Claims data.
Gold remains in a bullish trend as real yields are expected to fall during the Fed’s easing cycle. Any pullbacks may occur due to rate cut adjustments, but the overall upward trend should continue unless the Fed’s approach changes.
A potential major selloff in gold could happen with the upcoming US election. A Trump win might increase real yields due to higher growth and fewer expected rate cuts.
Gold Technical Analysis – Daily Timeframe

The daily chart shows gold hitting a new all-time high. If there’s a pullback to the main trendline, buyers may use it as a position to target new highs, while sellers will seek a break below to aim for the 2500 level.
Gold Technical Analysis – 4 Hour Timeframe

The 4-hour chart shows a minor upward trendline supporting bullish momentum. Buyers will likely focus on this trendline to target new highs, while sellers may attempt to break lower to reach the main trendline.
Gold Technical Analysis – 1 Hour Timeframe

The 1-hour chart shows a support zone around the previous all-time high, coinciding with a minor trendline. Buyers have a favorable risk-reward setup at this support level for new highs. Sellers will look for a break below to disrupt the bullish setup and aim for the major trendline.
The red lines indicate today’s average daily range.

