Fundamental Overview
The US Dollar is losing strength as GBPUSD holds steady despite strong US economic data. Retail sales and jobless claims from the US exceeded expectations.
The market has adjusted its expectations for rate cuts, aligning closely with the Federal Reserve’s forecasts. To see any changes in this outlook, we need stronger US data and signs of rising inflation.
Key upcoming events include the October data release, the FOMC decision, and the US election in November.
In the UK, recent consumer price index data fell short, leading markets to expect a 25 basis point cut in December. However, strong UK retail sales data has lifted the GBP.
GBPUSD Technical Analysis – Daily Timeframe

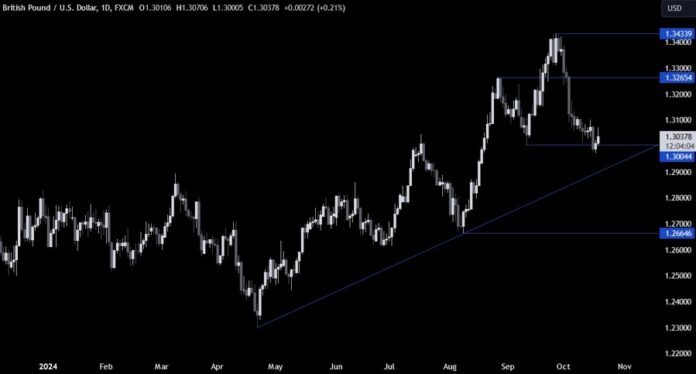
The daily chart shows GBPUSD bouncing back from the 1.30 level despite strong US data. Buyers are entering at this level, aiming for a rally towards 1.3265, while sellers want to see a drop below to continue the downward trend.
GBPUSD Technical Analysis – 4 Hour Timeframe

The 4-hour chart shows a spike up after UK retail sales, but the price was rejected by a downward trendline. For buyers, breaking above the trendline is essential; sellers will continue to target lower prices.
GBPUSD Technical Analysis – 1 Hour Timeframe

The 1-hour chart shows the price testing strong support at 1.3035, a level where a previous swing and a minor trendline converge. Buyers are likely to push for a break above the downward trendline, while sellers aim for a drop to 1.29.

