Market Overview
The US Dollar’s strength is fading as GBPUSD holds steady despite positive US data. Recent US Retail Sales surpassed expectations and Jobless Claims were better than anticipated.
Importantly, aggressive rate cut forecasts have been diminished, aligning expectations with the Fed’s outlook. Increased US data and inflation indicators are needed for a potential pause in the Fed’s easing cycle.
Key events to watch in November include October data releases, the FOMC policy meeting, and the US elections.
On the UK side, the recent UK CPI report was below expectations, leading the market to anticipate a 25 basis point cut in December. However, strong UK Retail Sales data this morning has lifted the GBP.
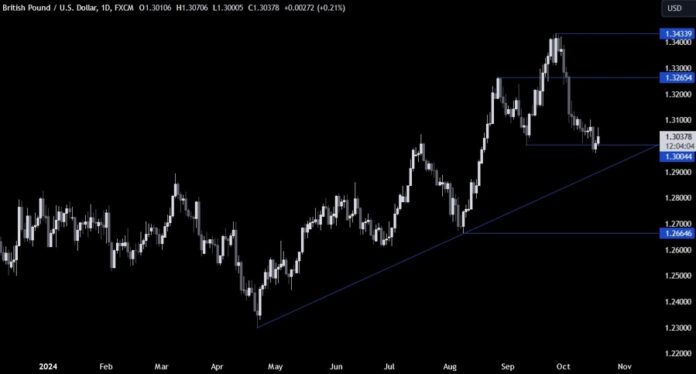
GBPUSD Technical Analysis – Daily Chart

The daily chart shows GBPUSD failing to drop below the 1.30 mark, and it has bounced higher. Buyers are entering at these levels, aiming to push back toward 1.3265, while sellers want a break below to extend declines.
GBPUSD Technical Analysis – 4 Hour Chart

The 4-hour chart displays an upward spike after the UK retail data but a rejection at the downward trendline. Buyers need to break this line to aim for new highs, while sellers will target new lows.
GBPUSD Technical Analysis – 1 Hour Chart

On the 1-hour chart, the price is bouncing around a solid support zone at 1.3035. Buyers are likely to enter here aiming to break above the downward trendline, while sellers will look for a drop to the 1.29 level.
`

