Fundamental Overview
Copper lost most of its gains from last month as China’s easing measures didn’t have the expected impact, paralleling a 14% drop in the Hang Seng index. Copper prices are closely tied to the Chinese stock market, given that China accounts for 60% of global copper demand. More easing measures are needed from China for prices to rise again.
Copper Technical Analysis – Daily Timeframe

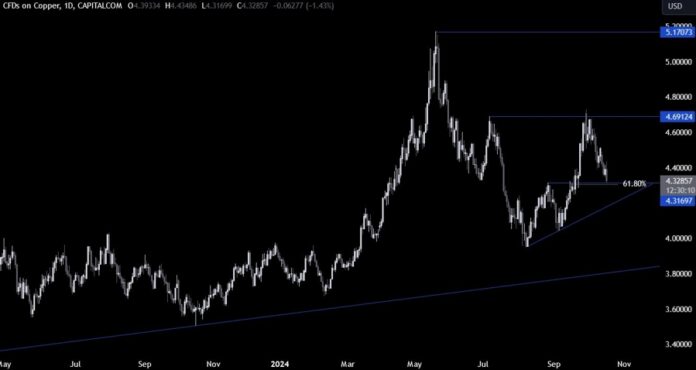
On the daily chart, copper struggled to rise above 4.70 and fell to 4.32. Buyers may enter around this level with defined risk, looking to push back toward the 4.70 resistance. Sellers aim to break lower, increasing bearish positions toward the trendline.
Copper Technical Analysis – 4 Hour Timeframe

The 4-hour chart shows a downward trendline indicating bearish momentum. Sellers may continue to sell at this line, while buyers look for a breakout above to target the 4.70 resistance.
Copper Technical Analysis – 1 Hour Timeframe

The 1-hour chart reveals strong support around the 4.32 level, coinciding with a 61.8% Fibonacci retracement. Buyers may target a bounce here, while sellers hope to break through for new lows. The red lines indicate today’s average daily range.
Upcoming Catalysts
Today, we will receive US Retail Sales and Jobless Claims data.

